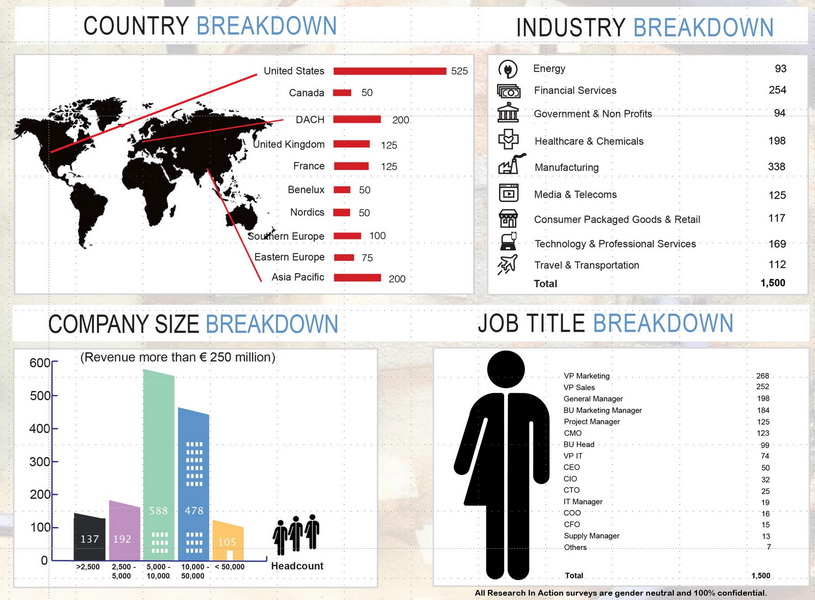
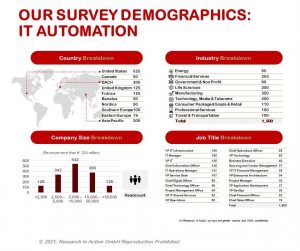
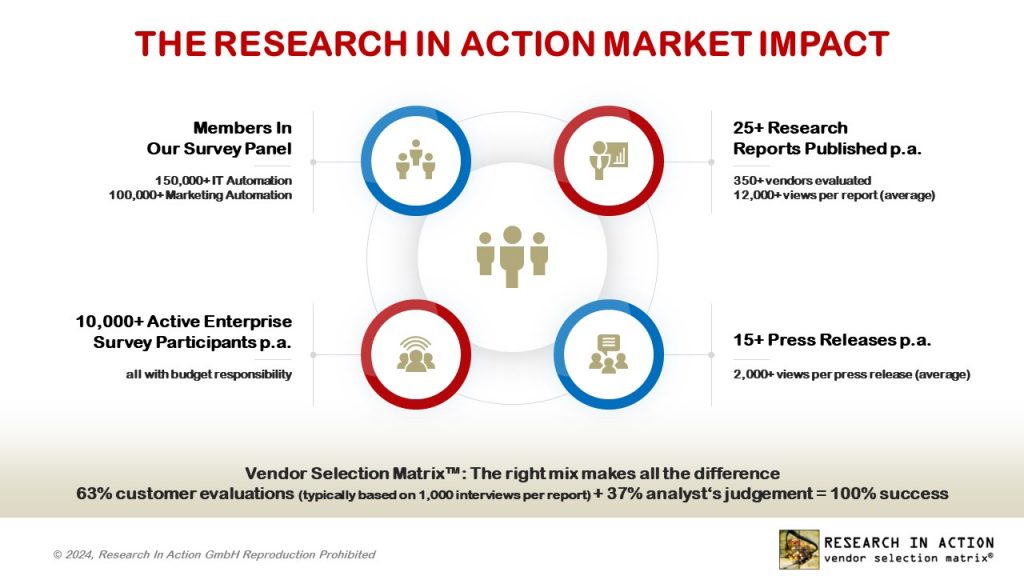
Every year, Research In Action surveys 10,000+ enterprise IT and business decision makers in order to gain insights on strategy, investments and ongoing challenges of technology innovation in the IT and marketing automation realm.
Data-To-Go™ is a tool to cater to organizations seeking quality data without the overhead of traditional survey development and analysis, using an AI mining tool on our extensive Research In Action survey database.
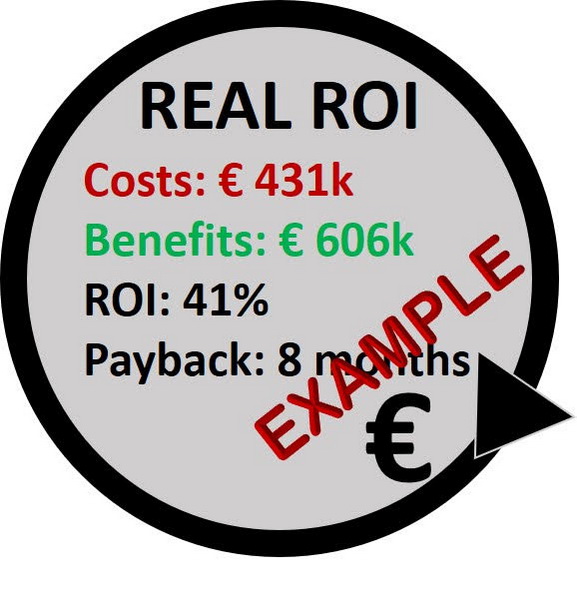
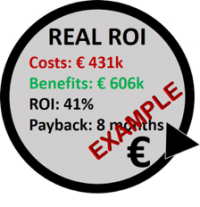
The Research In Action Real RoI Calculations™ takes an approach of statistical validity. Every Real RoI Calculations™ project we do is specific to the product or service in question. We use a minimum of 25 survey results taken from actual customer implementa-tions or projects.
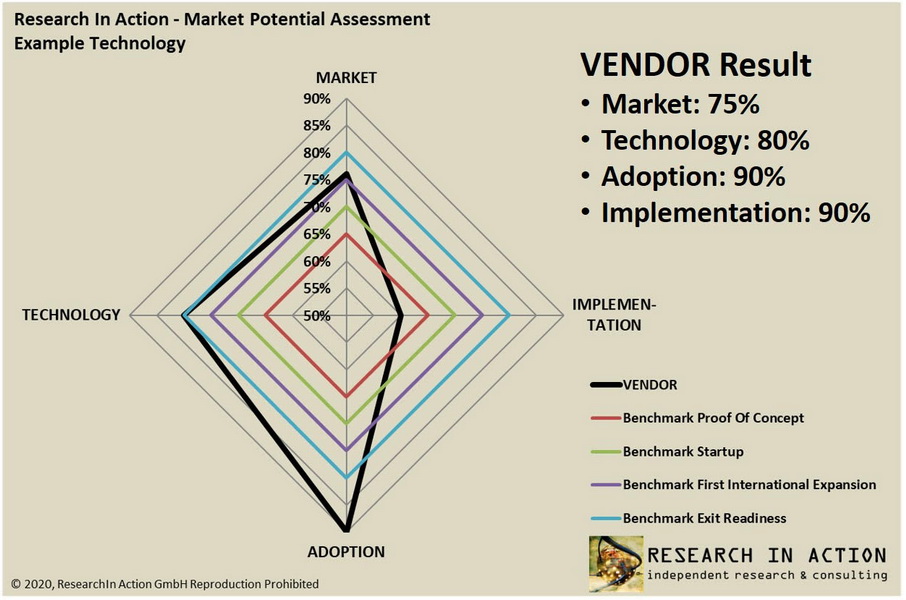
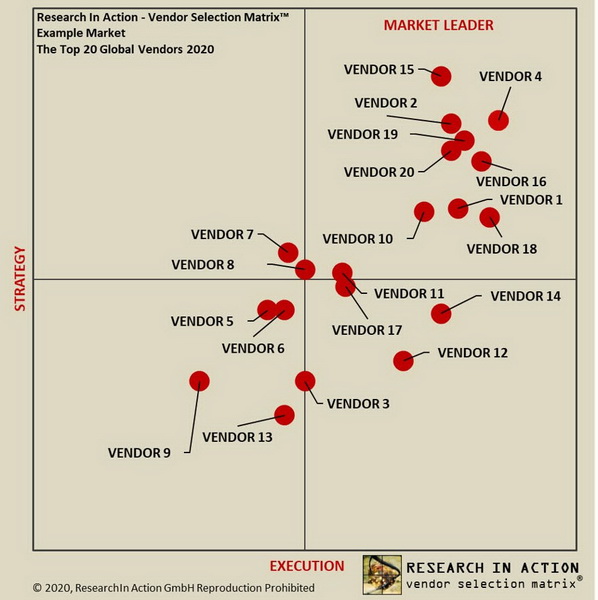
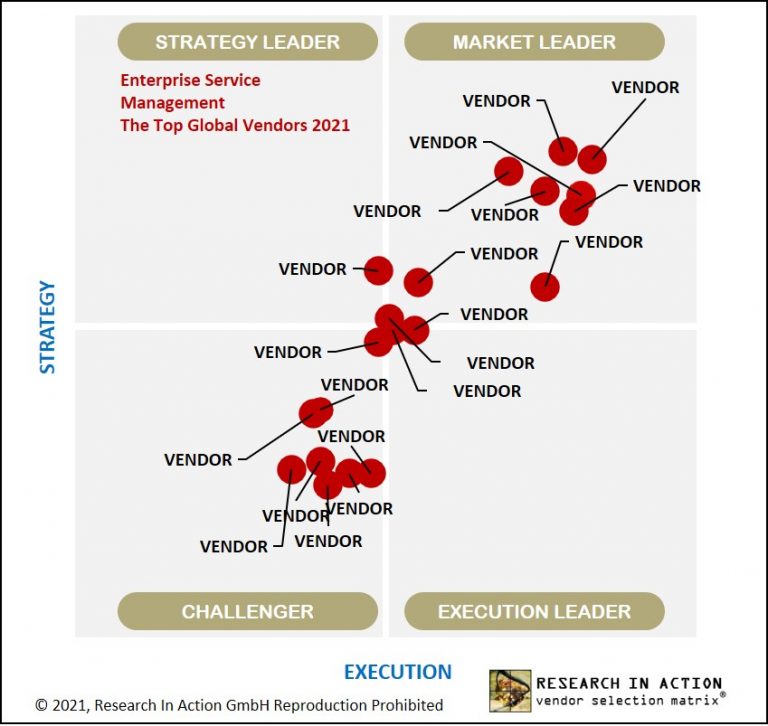
The Vendor Selection Matrix™ is a primarily survey-based methodology for vendor evaluation where 63% of the evaluation is based on a survey of enterprise IT or business decision makers and 37% on the analyst’s opinion.